Analyse of the results
Analyse of the results
Open the file “Plot.sci” file with Scilab and execute it.
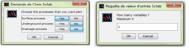
Some pop ups ask you to select plots:
Concerning the surface processes, it is possible to create a series of maps of the water overland depth and/or the infiltration rate. It is also possible to plot a graph with the surface discharge at each report station defined in the “general_input.txt” file.
To create a series of maps, select the surface processes by clicking on the “Yes” or “No” buttons for each kind of process. Click on the “OK” button. Then Choose the “Maps” option and click on the “OK” button.