We have seen during this lecture that in the nature, the different measured fields are characterized by a hierarchy of singularities. This means that we need for more than one fractal dimension in order to fully characterize the field. For this exercise we use the python script give in Fractal lecture.
Question
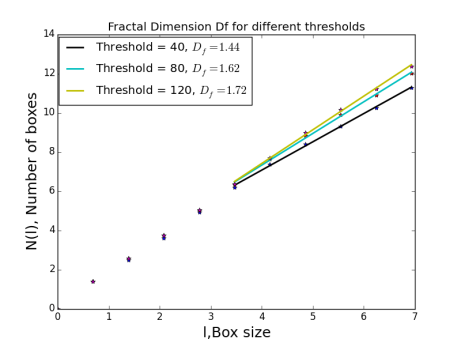
Use the script in Fractal lecture to estimate the fractal dimension for different thresholds : 120, 80, 40
The estimation of the fractal dimension for different threshold shows that the field (image) is characterized by a hierarchical singularities which lead to different estimation of the fractal dimension.
We can also observe that this change in the threshold affects only some range of scale (small scales).
1
# -*- coding: utf-8 -*-
2
"""
3
@author: yacine.mezemate
4
"""
5
importscipyassp
6
importnumpyasnp
7
importmatplotlib.pyplotasplt
8
9
#*************Imgae import and zoom****************
10
image = sp.misc.imread('fractal_tree.JPG')
11
RescaledImage = image[10:1034, 120:1144, 2]
12
plt.figure(0)
13
plt.imshow(image)
14
plt.title("Original image")
15
16
#************Threshold*****************
17
ThresholdImage = np.zeros((1024,1024)) #Allocation of memory
18
foriinrange(1024):
19
forjinrange(1024):
20
ifRescaledImage[i,j] <120:
21
ThresholdImage[i,j] = 1
22
else:
23
ThresholdImage[i,j] = 0
24
plt.figure(1)
25
plt.imshow(ThresholdImage, cmap=plt.cm.gray)
26
plt.title("Imgae zoom with threshold")
27
28
#*************Box counting****************
29
width = max(ThresholdImage.shape) # Maximum resolution
30
p = sp.log(width)/sp.log(2)
31
l= np.zeros((p+1)) # Memory allocation of range of scale
32
nOnes = sp.zeros(p+1)
33
34
forninrange(int(p)+1):
35
l[n]=sp.power(2,n) # Resolution
36
37
nOnes[p] =sp.count_nonzero(ThresholdImage) # Number of ones