What we call a chaotic pendulum is just a pendulum with friction and a driving torque but with no small-deflection-angle approximation. Putting these parameters together we have the equation of motion of the nonlinear pendulum:
Where is acceleration due to gravity, is the length of string, is the velocity dependent damping force and is the sinusoidal driving force. Therefore the value of will determine the driving force, with being the system with no driving force.
Question
1 - Write a program to solve the above equation.
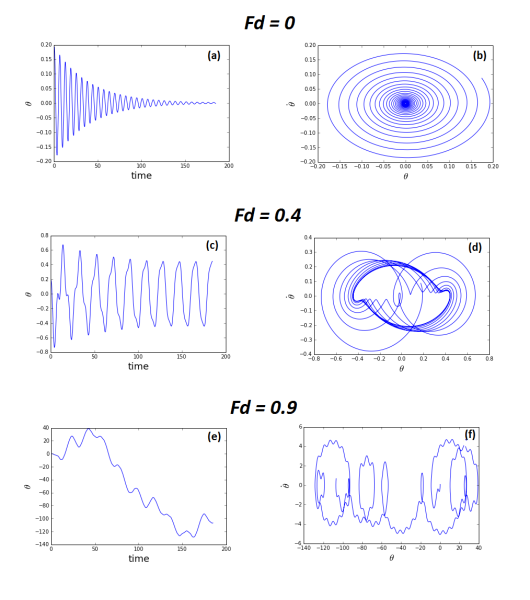
2 - Plot the time evolution of and the phase space for the following values of : 0, 0.4, 0.8. Comment the obtained result.
"""
@author: yacine.mezemate
"""

# Implementing the Euler-Cromer Method for a set number of data points
from __future__ import division
from math import *
from scipy import *
import numpy
import matplotlib.pyplot as plt

# Initial theta values
theta0 = (10*2*pi)/360
omega0 = 5*2*pi/360

# Constants
L = 9.8
g = 9.8
omega_d = 1/3
damping_force = 0.05

# Defining the driving force - controls the chaos
f0 = 0.9

# Assigning the number of data points to be considered
data_points = 3700

# Preallocating space for time, theta and omega
time = zeros(data_points)
theta = zeros(data_points)
omega = zeros(data_points)

# Initializing theta and omega
theta[0] = theta0
omega[0] = omega0

# Time step
dt = 0.05

for i in range(0, data_points-1):
    time[i+1] = time[i] + dt

    omega[i+1] = omega[i] - (g/L)*sin(theta[i])*dt - (
    damping_force*omega[i]*dt + f0*sin(omega_d*time[i])*dt)

    theta[i+1] = theta[i] + omega[i+1]*dt

plt.figure(1)
plt.plot(time, theta)
plt.ylabel(r"$\theta$", fontsize=18)
plt.xlabel(r"time", fontsize=18)
plt.show()


plt.figure(2)
plt.plot(theta, omega)
plt.ylabel(r"$\dot{\theta}$", fontsize=18)
plt.xlabel(r"$\theta$", fontsize=18)
plt.show()

 is acceleration due to gravity,
 is the length of string,
 is the velocity dependent damping force and
 is the sinusoidal driving force. Therefore the value of
 will determine the driving force, with
 being the system with no driving force.
 and the phase space for the following values of