Spectral Analysis

Energy spectra in geophysics : atmosphere

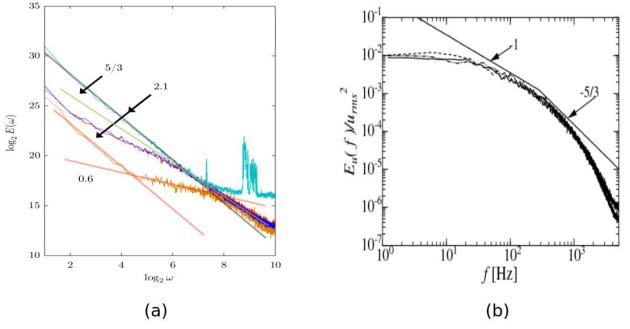
(a) : Plots of the horizontal u and v-components (red and blue), the temperature(turquoise) and the relative humidity (orange) spectra [G.Fitton, 2013], (b) : Power spectrum of streamwise velocity fluctuations [Yasuhiko Sakai et al , 2011]InformationInformation[1]

The PSD is also used in atmospheric research in order to identify some processes, the figure(a) shows the PSD of wind velocity and the atmospheric temperature, we can observe that the horizontal velocity components are characterized by an isotropic turbulence (Kolmogorov 1941) and the vertical component is characterized by a stratification. In the figure(b) we observe that there exist two scaling regime corresponding to an isotropic turbulence and a wall turbulence .

  1. (a): Fitton, G. (2013). Multifractal analysis and simulation of wind energy fluctuations (Doctoral dissertation, Université Paris-Est). (b) : Nagata, K., Sakai, Y., & Komori, S. (2011). Effects of small-scale freestream turbulence on turbulent boundary layers with and without thermal convection. Physics of Fluids (1994-present), 23(6), 065111.

PreviousPreviousNextNext
HomepageHomepagePrintPrintCreated with Scenari (new window)