"""
@author: yacine.mezemate
"""
import scipy as sp
import numpy as np
import matplotlib.pylab as plt
import random
import math

max = 4000
signal = sp.zeros((max),float)
ps = sp.zeros((max),float)
step = 2*math.pi/1000

def func(array,max):
    f = sp.zeros((max + 1),float)
    step = 2*sp.pi/1000; x = 0.
    for i in range(0,max):
        f[i] = 1/(1. - 0.9*sp.sin(x))             # Function
        signal[i] = (1./(1-0.9*sp.sin(x)))+0.5*(2.*random.random()-1.) # noise
        x += step

def filtr():                           # Low-pass windowed - sinc filter
    y = sp.zeros((max),float); h = sp.zeros((max),float)
    m = 100                              # Set filter length (101 points)
    fc = .07
    for i in range(0,100):             # Calculate low-pass filter kernel
        if ((i-(m/2)) == 0):  h[i] = 2*sp.pi*fc
        if ((i-(m/2))!= 0):   h[i] = sp.sin(2*sp.pi*fc*(i-m/2))/(i-m/2)
        h[i] = h[i]*(0.54 - 0.46*sp.cos(2*sp.pi*i/m))          # Hamming window
    sum = 0.                           # Normalize low-pass filter kernel
    for i in range(0,100):  sum = sum + h[i]
    for i in range(0,100):  h[i] = h[i] / sum
    for j in range(100,max-1):               # Convolve input with filter
        y[j] = 0.
        for i in range(0,100): y[j] = y[j] + signal[j-i] * h[i]

    return y

#Calulate the PSD
def spectra(data):

    L = sp.power(2,12)
    data = data[0:L]
    FMax=np.floor(L/2)
    f = sp.arange(1,FMax+1,1)
    E = sp.zeros((FMax,))

    Buffer = np.absolute(np.fft.fft(data))
    E = Buffer[0:FMax]*Buffer[0:FMax]
    plt.figure(0)
    plt.loglog(f,E)
    plt.xlabel("f", fontsize =18)
    plt.ylabel("PSD", fontsize =18)

func(signal,max)
spectra(signal)

fi = filtr()
spectra(fi)


#plot noise signal
plt.figure(1)
plt.plot(signal)
plt.xlabel("t", fontsize =18)
plt.ylabel("y(t)", fontsize =18)

#plot filtred signal
plt.figure(2)
plt.plot(fi)
plt.xlabel("t", fontsize =18)
plt.ylabel("s(t)", fontsize =18)
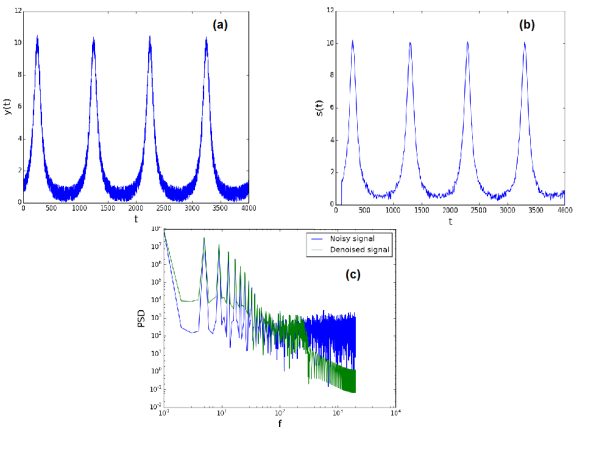
(a) Noisy signal, (b): Denoised signal, (c): The corresponding PSD

 . Where
 is an adjustable parameter.