
GEV distribution
The goal of this exercise is to learn who to generate a random variable according to some probability law and plot the corresponding PDF.
Question
Generate a random variable according to the Gumbel distribution with location
 and scale

Plot the PDF of random variable and the corresponding histogram.
Change the parameters and comment the obtained result.
Do the same thing for Weibull variable
Solution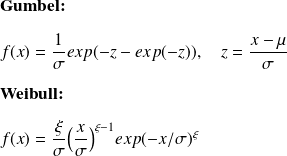
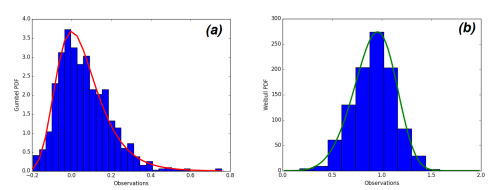
(a) : Gumbel distribution; (b): Weibull distribution
The Gumbel random variable (RV) can be generated using the Python's function random.gumbel with the appropriate parameters.
In order to plot the PDF, first we calculate the histogram of the RV, then the PDF in computed according to:
1
"""2
3
@author: yacine.mezemate4
"""5
6
import numpy as np
7
import matplotlib.pylab as plt
8
9
10
#Gumbel11
mu, sigma = 0, 0.1 # location and scale
12
s = np.random.gumbel(mu, sigma, 1000)
13
plt.figure(0)
14
count, bins, ignored = plt.hist(s, 30, normed=True)
15
plt.plot(bins, (1/sigma)*np.exp(-(bins - mu)/sigma) * np.exp( -np.exp( -(bins - mu)
16
/sigma) ),lw=3, color='r')
17
plt.xlabel('Observations')
18
plt.ylabel('Gumbel PDF')
19
20
21
#Weibull22
a = 5. # shape
23
s = np.random.weibull(a, 1000)
24
x = np.arange(1,100.)/50.
25
26
def weib(x,n,a):
27
return (a / n) * (x / n)**(a - 1) * np.exp(-(x / n)**a)
28
29
plt.figure(1)
30
count, bins, ignored = plt.hist(np.random.weibull(5.,1000))
31
scale = count.max()/weib(x, 1., 5.).max()
32
33
plt.figure(1)
34
plt.plot(x, weib(x, 1., 5.)*scale, lw =3)
35
plt.xlabel('Observations')
36
plt.ylabel('Weibull PDF')


