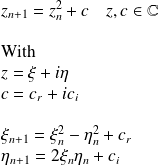
The Mandelbrot set is simple rule that can create a self-similar fractal structure. It is probably the most famous fractal, having gained its popularity from the fascinating glossy images by Heinz-Otto Peitgen and Peter Richter in their famous book The Beauty of Fractals. As a fractal, the Mandelbrot set is a self-similar structure, which lives in the complex plane, and contains infinitely many copies of itself. It is created when the complex valued map:
The initial value is and the constant is the location in the complex plane with as - and as -value, respectively.
Question
Write a python (matlab) program to draw the Mandelbrot set.
"""
@author: yacine.mezemate
"""

import matplotlib.pylab as plt
import numpy as np

def Man(c):
	z = 0
	for n in range(1, 100):
		z = z**2 + c
		if abs(z) > 2:
			return n
	return np.NaN

X = np.arange(-2, .5, .004)
Y = np.arange(-1,  1, .004)
Z = np.zeros((len(Y), len(X)))

for j, y in enumerate(Y):
	print (j, "of", len(Y))
	for i, x in enumerate(X):
		Z[j,i] = Man(x + 1j * y)

plt.imshow(Z, cmap = plt.cm.prism, interpolation = 'none', extent =
      (X.min(), X.max(), Y.min(), Y.max()))

plt.xlabel("Real(c)", fontsize = 18)
plt.ylabel("Imaginary(c)", fontsize = 18)
plt.title("Mandelbrot set", fontsize = 18)
plt.show()

 and the constant
 is the location in the complex plane with
 as
as
 - and
- and
 as
as
 -value, respectively.


